drug_couse
Drug couse
Method(s) to analyze patient drug couse.
Dependencies
pip install drug_couse
https://pypi.org/project/drug_couse/

uv pip install --system fastparquet matplotlib mlxtend openpyxl pandas
or
uv pip install --system --upgrade matplotlib pandas

run examples\arm.py
Likelihood measure
Question: Likelihood of a patient taking drug A also taking drug B?
1. Association Rule Mining (ARM)
ARM is an Apriori Algorithm similar to market basket analysis where you can identify associations between different drugs. You can look for rules like “if a patient takes Drug A, they are likely to take Drug B”.
Metrics
-
Support
Relative fequency of a particular combination of drugs occuring.
Support(A,B) = Count(A and B) / Total patients
Support = 0.3 means 30% of patients take both drugs
-
Confidence
Probability that Drug B is taken given Drug A is taken.
Confidence(A→B) = Count(A and B) / Count(A)
Confidence = 0.8 means 80% of patients who take Drug A also take Drug B
Confidence is a measure of the reliability of the rule.
-
Lift
Measures the deviation from independence. How much more likely Drug B is when Drug A is present vs. baseline (random chance).
Lift(A→B) = Confidence(A→B) / Support(B)
Lift = 1: Completely independent or no association (random)
Lift > 1: Positive association (Drug A increases likelihood of Drug B)
Lift < 1: Negative association (Drug A decreases likelihood of Drug B)
Lift = 2.0: Patients taking Drug A are 2x more likely to take Drug B than average -
Conviction
How much more often the rule would be incorrect if Drug A and Drug B were independent.
Higher values: Stronger rules
What to Look For
- High Confidence Rules (>0.7): Strong predictive relationships
- High Lift Rules (>2.0): Interesting associations beyond random chance
- Reasonable Support (>0.1): Patterns that affect a meaningful number of patients
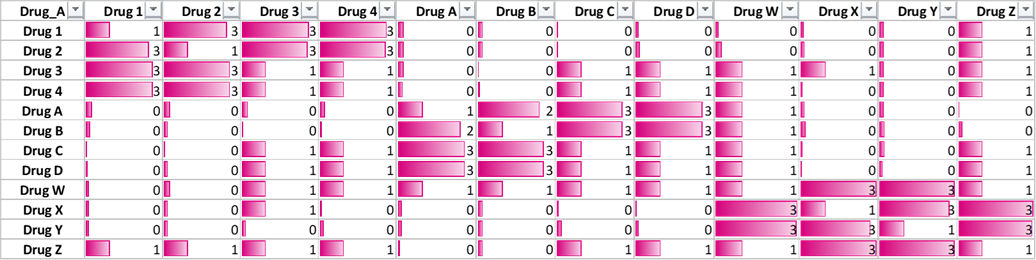
example\arm.py\ Output crosssection
Confidence Matrix
In real data the confidence matrix will show relationships most likely in clusters.
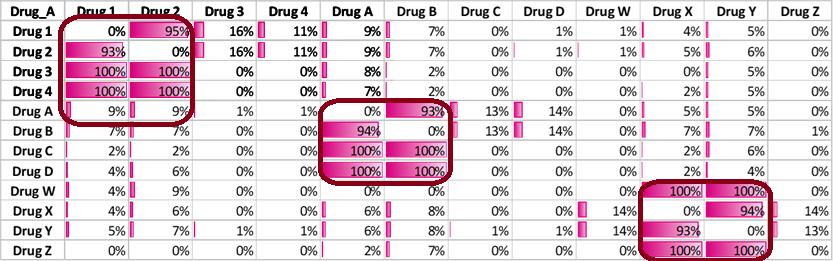
The lift relationship shall follow similar pattern.
example\arm.py\ Log
🚀 Creating Complete Drug Relationships Matrix:
============================================================
🔄 Preprocessing data...
✅ Data preprocessed: 1000 patients, 12 unique drugs

📋 Transaction Matrix Shape: {transactions.shape}
Sample of transaction matrix:
   Drug 1  Drug 2  Drug 3  Drug 4  Drug A  Drug B  Drug C  Drug D  Drug W  Drug X  Drug Y  Drug Z
0   False   False   False   False   False   False   False   False   False    True    True   False
1   False   False   False   False   False   False   False   False   False    True    True   False
2    True    True    True   False    True   False   False   False   False   False   False   False
3   False   False   False   False    True    True   False    True   False   False   False   False
4   False   False   False   False   False   False   False   False   False    True    True   False

📈 Drug Usage Statistics:
==================================================
Total patients: 1000
Total unique drugs: 12

Top 10 most prescribed drugs:
  Drug X: 366 patients (36.6%)
  Drug Y: 363 patients (36.3%)
  Drug 1: 362 patients (36.2%)
  Drug 2: 355 patients (35.5%)
  Drug A: 351 patients (35.1%)
  Drug B: 351 patients (35.1%)
  Drug 3: 52 patients (5.2%)
  Drug 4: 49 patients (4.9%)
  Drug D: 48 patients (4.8%)
  Drug C: 47 patients (4.7%)
🔍 Finding frequent itemsets with min_support=0.2...
✅ Found 9 frequent itemsets

📊 Top 10 Frequent Itemsets:
   support          itemsets
4    0.366          (Drug X)
5    0.363          (Drug Y)
0    0.362          (Drug 1)
1    0.355          (Drug 2)
2    0.351          (Drug A)
3    0.351          (Drug B)
8    0.342  (Drug X, Drug Y)
6    0.329  (Drug 2, Drug 1)
7    0.329  (Drug B, Drug A)
📊 Generating association rules with min_confidence=0.5...
✅ Generated 6 association rules
🔄 Calculating relationships for ALL drug pairs...
   Analyzing 12 drugs = 132 possible relationships
✅ Calculated 92 drug-to-drug relationships
✅ Saved parquet file: complete_drug_relationships_matrix.parquet
❌ Error exporting to Excel: [Errno 13] Permission denied: 'complete_drug_relationships_matrix.xlsx'
✅ Saved as CSV and Parquet: complete_drug_relationships_matrix.csv/.parquet

📈 Complete Analysis Summary:
   Total drug pairs analyzed: 92
   High confidence relationships (60%+): 18
   Strong associations (Lift 2.0+): 30
   High priority relationships: 18

📊 File Size Comparison:
========================================
   Excel: 0.03 MB
 Parquet: 0.01 MB
     CSV: 0.01 MB

📁 Output Files Generated:
   📊 Excel File: complete_drug_relationships_matrix.xlsx
      • Multiple sheets with filtered views
      • Pivot tables for easy analysis
      • Summary statistics
   📦 Parquet Files: Multiple .parquet files for different views
      • Faster loading for large datasets
      • Better compression than CSV
      • Preserves data types

🔄 Demonstration: Loading Parquet Data
✅ Loaded parquet file: complete_drug_relationships_matrix.parquet
   Shape: (92, 14)
   Columns: ['Drug_A', 'Drug_B', 'Patients_A', 'Patients_B', 'Patients_Both', 'Support', 'Confidence', 'Confidence_%', 'Lift', 'Leverage', 'Conviction', 'Rule_Strength', 'Clinical_Priority', 'Relationship_Type']
   Sample of loaded data:
   Drug_A Drug_B  Confidence_%  Lift Rule_Strength
Drug D Drug A         100.0 2.849   Very Strong
Drug D Drug B         100.0 2.849   Very Strong
Drug C Drug A         100.0 2.849   Very Strong

============================================================
🎉 Enhanced Analysis Complete with Dual Export!
📋 Key Features:
   ✅ Excel export with multiple sheets
   ✅ Parquet export for large datasets
   ✅ Automatic handling of Excel row limits
   ✅ File size comparisons
   ✅ Easy data loading utilities
============================================================